
Re-litigation
Old problems return to the agenda because the original context was lost.
Product case
Engineering has Git. What about product decisions? This case shows a system that connects signal, evidence, hypothesis, experiment and decision in a single causal graph.
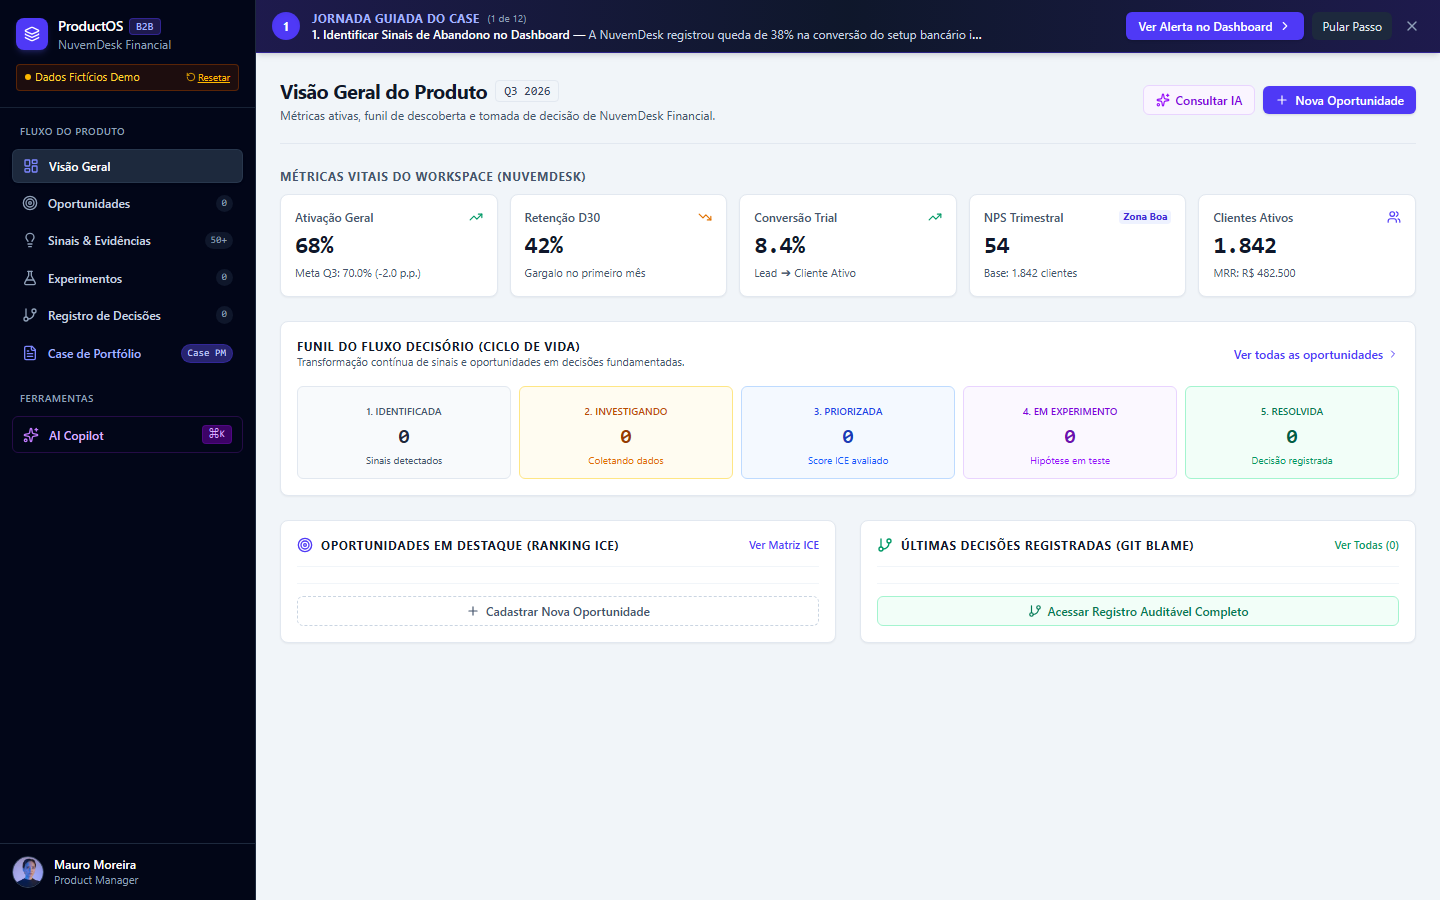
NuvemDesk Financial demo workspace — fictional data created for this case.
01 — The problem
In engineering, almost every important change leaves a trail. A commit shows what changed. A pull request shows the context. History makes it possible to see who changed it, when and why.
In Product, the picture is often different. A decision may start in a meeting, on Slack, in an interview, in Analytics, in a support ticket or in a sales request.
Months later, the team finds the same decision and cannot answer the essential question:
Why did we do this?
That pile-up of lost context is the problem I call Decision Debt.
02 — Decision Debt
Decision Debt happens when the knowledge needed to understand a decision becomes fragmented, outdated or simply disappears.
Old problems return to the agenda because the original context was lost.
New teams decide without knowing what was learned before.
People have to rebuild context through meetings and conversations.
An experiment ends, but its learning does not necessarily stay.
ProductOS was designed as a response to that problem.
03 — The idea
The core hypothesis of ProductOS is that a decision must stay connected to the context that produced it.
Continuous Causal Graph
What happened?
What did we notice?
Which problem deserves attention?
Which facts support this?
What do we believe might work?
How will we test it?
What happened?
What did we decide to do?
What did we learn?
That chain is the Continuous Causal Graph of ProductOS. Each element answers a different question — and stays linked to the others.
04 — The Product Loop
The full flow was structured so learning returns and becomes part of the context of the next decisions.
05 — The NuvemDesk case
To show the platform working, I created the NuvemDesk Financial workspace: a financial-management SaaS for small and mid-size companies.
25,482
active users
1,842
paying customers
R$ 3.8M
ARR in the scenario
148
#erro-ofx tickets
Every figure in this scenario is demonstrative and was created to represent a plausible product situation.
06 — Discovery
The first step is to observe what is happening. In the case, signals come from different sources — and they only make sense when they intersect.
A drop in onboarding conversion.
Tickets related to OFX import problems.
Customers reporting friction with bank reconciliation.
Interviews with finance and accounting users.
Combining those signals moves the team from an isolated observation to a problem hypothesis.
07 — Finding the problem
Onboarding telemetry showed a significant drop at the bank-setup step.
68.2%
Baseline
42.0%
setup completion at the OFX file upload step
Crossing that metric with support tickets revealed a pattern: new customers were struggling to import and interpret bank files.
The problem was identified by triangulating quantitative and qualitative data — not from a single source.
08 — From evidence to opportunity
From the signals, the PM can create a structured Opportunity.
Direct bank connection via Open Finance
That turns an observation into a Product work object.
09 — Prioritization
ProductOS uses an ICE matrix to structure prioritization: Impact × Confidence ÷ Effort.
Impact
5
Confidence
4
Effort
2
ICE Score
10.0
The opportunity then sits first among those evaluated in the scenario. The point is not to claim ICE is the only method — it is to show how an explicit criterion makes the decision more transparent.
10 — Hypothesis
If we connect bank accounts via Open Finance, for new customers during onboarding, we expect bank-setup completion to rise from 42% to over 60%, because the data indicate that a relevant share of drop-off is tied to importing and reading OFX files.
Defines the action and the audience.
Defines the expected impact.
Can be confirmed or rejected.
Makes the rationale explicit.
11 — Experimentation
A/B test
Current flow with OFX upload.
Bank connection via Open Finance.
Sample
1,200 new companies
Duration
30 days
Primary metric
Bank-setup completion
12 — Result
42.0%
Baseline
58.4%
Variant B
+39%
relative lift
-41%
related support tickets
98.4%
confidence in the scenario
These numbers belong to the case's demonstrative dataset, used to simulate the full decision loop.
13 — Decision Log
SCALE
The decision records outcome, rationale, owner, next steps, evidence and learning — and stays attached to the context that originated it.
The decision history works like Git Blame for Product: not to track code, but to answer those four questions.
14 — Product architecture
Each module represents a stage or a need in the process.
A snapshot of metrics and the decision funnel.
Signals and evidence gathered in one place.
Problems structured as work objects.
Hypotheses under test, with metric and scope.
An auditable record of what was decided and why.
AI with access to workspace context.
15 — The traceability core
The Opportunity screen is the center of the model. The intent is for the user to navigate context without rebuilding it by hand.
Opportunity
16 — Contextual AI
The Copilot operates on the context available in the workspace. It can analyze signals, find patterns in feedback, summarize evidence, suggest hypotheses, calculate prioritization and help interpret experiments.
Example
“Which problems show up most often in the last 30 days?”
The AI queries available signals before producing an answer.
The conceptual architecture uses specialized tools so the AI works with structured product information instead of relying on text generation alone.
18 — Integrations
The model was designed to receive signals from Analytics, support, research and Open Finance. In the NuvemDesk scenario, bank connection via Open Finance is the intervention proposed in the experiment.
Mixpanel · Amplitude · PostHog
Zendesk · Intercom · Freshdesk
NPS · Typeform · Hotjar
Pluggy · Belvo
19 — Technical architecture
ProductOS was built as a navigable product, with domain rules and local-first persistence.
Frontend
React 19 + TypeScript
Build
Vite
Backend
Node.js + Express
Interface
Tailwind CSS
Icons
Lucide React
AI
Google GenAI SDK
Persistence
ProductOSStorage — local-first
Data
NuvemDesk demonstrative dataset
20 — An important technical decision
One principle was to block inconsistent transitions. An opportunity should not be marked Resolved without a formal decision attached.
That rule is enforced by the persistence engine. Technology does not only store information — it helps preserve product logic.
21 — Internal structure
The component architecture follows the product's core concepts, instead of being organized only as generic screens.
src/
├── main.tsx
├── App.tsx
├── types.ts
├── data/
│   ├── nuvemdesk-seed.ts
│   └── storage.ts
└── components/
    ├── Navigation
    ├── DashboardView
    ├── OpportunitiesView
    ├── OpportunityDetailModal
    ├── InsightsView
    ├── ExperimentsView
    ├── DecisionsLogView
    ├── AICopilotDrawer
    ├── PortfolioCaseModal
    ├── NewOpportunityModal
    └── GuidedTourBanner
22 — MVP
Can the full product decision loop live in a single, traceable experience?
That is why the first scope focused on what was essential to walk the loop.
Broader features can come later. The MVP exists to prove the concept, not to exhaust it.
23 — Guided Tour
Because the product was created as a portfolio case, there is a guided tour. The goal is for someone who has never used the platform to grasp the concept quickly.
Signal → Insight → Opportunity → Hypothesis → Experiment → Result → Decision
24 — What I wanted to show
The goal was to build a project that showed work at the intersection of product, experience, data, AI and technology.
Discovery, prioritization, hypotheses, experimentation and decision.
Information architecture, flows and context organization.
Metrics, evidence and quantitative plus qualitative analysis.
Contextual use of language models and tools.
Architecture, business rules, state and implementation.
25 — The rationale
The build followed a simple logic. The real work is the structure that connects each step.
26 — The outcome
The result is a working platform that can represent a complete product decision loop. From a set of signals, the user can:
identify a problem → structure an opportunity → assess priority → form a hypothesis → create an experiment → read a result → record a decision
Context stays connected throughout the process.
27 — Explore the product
The environment uses demonstrative data created specifically for this case.
There is a guided tour inside the platform itself.
28 — Learnings
It is not enough to organize screens and data. The relationships between them have to be structured.
A decision without its context loses part of its value over time.
The closer it is to domain data and rules, the more useful an AI application tends to be.
The application can help ensure the process defined by the product is respected.
The distance between understanding a problem and measuring a solution needs to stay small.
29 — Next steps
As a concept, ProductOS could evolve into a platform integrated with the real Product ecosystem.
Analytics, CRM, support, research and management tools.
Automatic anomaly detection and opportunity generation.
Continuous signal analysis and pattern detection.
Integration with testing platforms and metrics.
Contextual recommendation based on decision history.
The natural evolution would be to turn ProductOS from a decision-recording system into a continuous intelligence layer for Product.
ProductOS was built to make that trail useful.
If you're looking for someone who can talk to Marketing, Product, Design and Technology — let's talk.